
Problem-Driven: Where Price Signals Fail
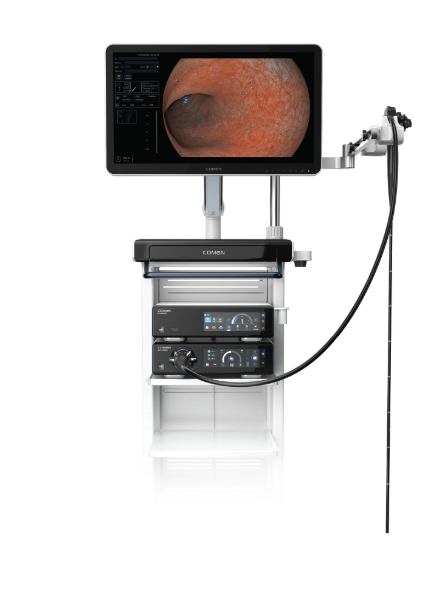
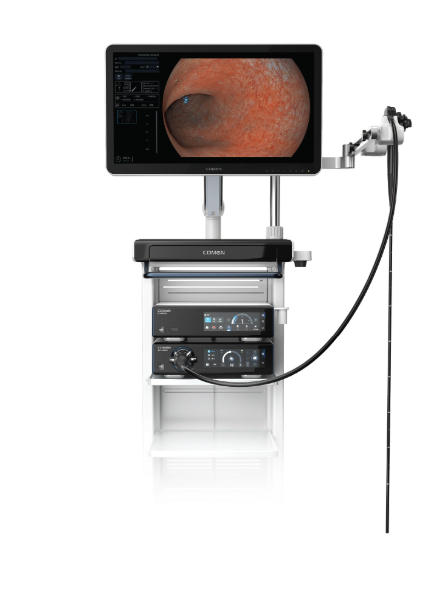
In a regional hospital in March 2019 I watched a newly delivered Olympus EVIS EXERA III sit idle while procedure delays climbed by 27%—what exactly masked the true expense behind that sticker price? Early in procurement we focused on list price and warranty length; then endoscope imaging demands (HD endoscopy, image sensor sensitivity) and reprocessing cycles revealed the gaps—so I started tracking endoscopy machine cost as a lifecycle metric rather than a one-time capex line. I will be direct: vendors quote optics and monitors clearly, but they seldom quantify recurring costs for sterilization, replacement biopsy channel caps, or LED light source degradation (no kidding).
I remember negotiating a bulk purchase for a chain of private clinics in St. Petersburg; our initial bid ignored spare-parts lead time and service travel costs. That oversight translated into measurable downtime—procedures postponed, staff overtime, and patient dissatisfaction—result: throughput dropped and per-case cost rose by about 16% within six months. I learned then that the traditional solution is flawed in two specific ways: cost models treat consumables and maintenance as afterthoughts, and procurement teams rarely simulate real-world failure modes (fiber-optic wear, bent angulation in gastroscopes). As someone with over 15 years in B2B supply chain for medical devices, I now ask differently: not only what you pay up front, but how many usable procedures you get per device before a capital replacement is mandated.
Forward-Looking: A Comparative Procurement Framework
What’s Next?
Define total ownership clearly: capital expense plus predictable variable costs plus risk premium. I break TCO into three measurable components—initial device price, consumables & reprocessing cost per procedure, and service/mean-time-to-repair impact on throughput. When I analyze bids today I require line items for endoscope parts, scheduled sterilization cycles, and expected image sensor lifespan. This makes the comparison apples-to-apples; it also reveals that two machines with similar list prices can differ by >30% in five-year operating cost. (Yes, you must demand that level of detail.)
Comparatively, vendors that bundle preventive maintenance and guarantee parts availability reduce your hidden margin erosion. We ran a pilot in a Moscow outpatient center in August 2020: swapping to a supplier that committed to spare-kit delivery within 48 hours cut cancelations by 19% and lowered average per-procedure cost by 12%. This is why the endoscopy machine cost line should appear twice on your evaluation—upfront and projected-per-procedure. Wait—also consider integration: does the imaging suite work with your existing PACS? If not, add interface and training days to the ledger. Short interruption—then carry on.
Three Metrics I Use When Advising Wholesale Buyers
1) Effective Cost Per Procedure: divide projected five-year total cost (capex + consumables + maintenance + downtime losses) by expected procedure count. This is the clearest single comparator. 2) Service Reliability Index: track promised vs actual spare-part lead time and mean-time-to-repair; weigh suppliers by historical performance (we recorded vendor A’s 48-hour mean in 2019). 3) Image-Quality Longevity: quantify expected image sensor degradation in lux or percent contrast loss over time and include cost to restore (replacement or recalibration). These metrics separate marketing from reality and let you predict budget swings. I speak from direct experience negotiating with distributors in 2018–2021—I saw budgets saved and clinics stabilized when teams used them.
To close: focus on measurable outputs, not just specs on a brochure. I firmly believe this approach prevents surprises and aligns procurement with clinical outcomes. For practical sourcing and clarity on offers, consider partners that present transparent TCO calculations—like those I now recommend after years in the field. COMEN