

Problem statement and diagnostic approach
Operators struggle to convert operational changes into quantifiable value; the question is not whether improvements exist but how to measure them reproducibly. This protocol treats fleet performance like a clinical case: define clear endpoints, select validated metrics, control for confounders, then apply interventions and re-measure. For stakeholders responsible for transport in extractive industries, begin by reviewing integrated telemetry and compliance records from your oil and gas fleet management deployments to establish a baseline sample of trips, fuel consumption, maintenance events and incident reports.

Case definition: primary endpoints to judge success
Define one financial endpoint and two operational endpoints. Example set: 1) Net annualized cost reduction (financial); 2) Availability rate (percentage of fleet ready for duty per schedule); 3) Safety incident rate (events per 100,000 miles). Keep endpoints binary and time-bound: report quarterly and annual values to capture seasonal variance.
Diagnostic metrics and required data elements
Collect the minimal dataset before intervention: odometer-hours, fuel volume and cost, maintenance labor hours and parts cost, GPS traces, idle time, driver shift logs, and incident narratives. From those, compute: – Utilization = (active vehicle-hours / scheduled vehicle-hours) × 100 – Mean Time Between Failures (MTBF) = total runtime / number of failure events – Mean Time To Repair (MTTR) = total repair hours / number of repairs – Fuel intensity = liters (or gallons) per 100 km (or mile) – Safety frequency = incidents / 100,000 miles – Total Cost of Ownership (TCO) per vehicle = acquisition amortized + operating costs + disposal costs
Common diagnostic pitfalls to avoid
Avoid attributing causation to interventions when seasonality or route mix changed. Do not compare pre- and post-intervention windows of unequal length. Beware selection bias: retiring older buses will change averages without indicating an operational improvement. Do not omit indirect costs (downtime impact on crew overtime, expedited parts shipping). Use consistent counting rules for incidents and repairs.
Interventions with measurable hypotheses
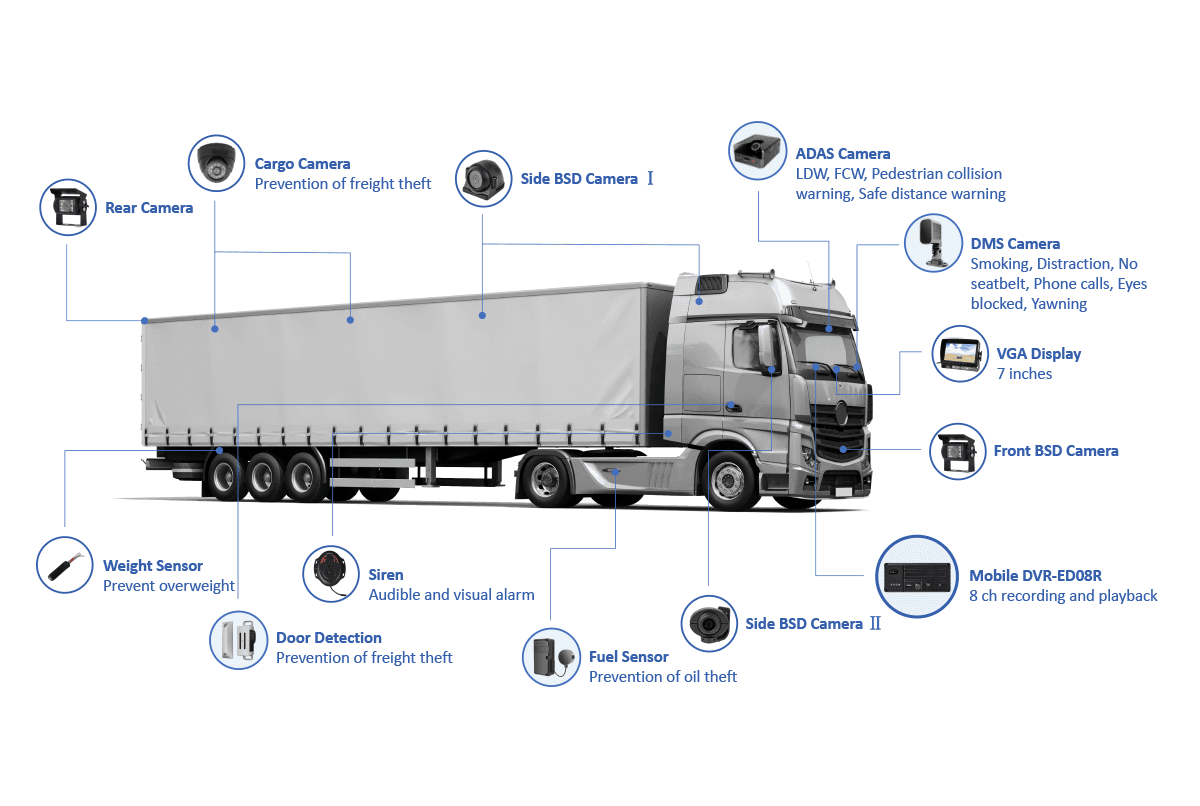
Structure each intervention as a hypothesis with expected effect size and timeframe. Examples: – Install telematics + driver coaching → expect 8–12% reduction in fuel intensity within six months – Predictive maintenance using vibration and fault codes → expect MTTR decrease and 15–25% fewer emergency repairs – Route consolidation and shift alignment → expect utilization increase of 5–10% and reduced overtime costs When treating fleets supporting offshore logistics, such as operations serving platforms in the Gulf of Mexico, prioritize interventions that reduce unscheduled trips and improve compliance documentation because mobilization costs there amplify marginal failures. For integrated deployments, reference the fleet management oil and gas telemetry to correlate equipment-level diagnostics with vehicle-level outcomes.
Simple analysis templates and decision rules
Use concise formulas to keep decisions objective. ROI (%) = (Annual net benefit ÷ Implementation cost) × 100. Annual net benefit = annual cost savings + quantified revenue gain − incremental operating costs. Payback period = Implementation cost ÷ Annual net benefit. Set trigger thresholds: implement if ROI > 25% or payback < 3 years for capital projects; pilot otherwise. For safety-driven programs, require incident reduction with statistical significance (p < 0.10 acceptable for operational pilots) before scaling.
Monitoring cadence and escalation criteria
Report primary endpoints monthly, secondary metrics weekly. Set automated alerts for: – Utilization drop > 8% month-over-month – MTTR increase > 20% – Fuel intensity spike > 10% These conditions prompt a root-cause review within 72 hours. Maintain versioned baselines: annotate every change in route, fleet composition, or external cost inputs to preserve attribution integrity.
Synthesis and operational recommendation
Apply the protocol iteratively: baseline, test one intervention at a time, measure with the defined endpoints, and accept or reject based on pre-defined thresholds. This disciplined, clinical workflow reduces ambiguity and leads to reliable decisions about fleet investments. For operators who need a repeatable diagnostic and deployment path informed by telemetry and maintenance analytics, BSJ provides systems that map directly to the metrics and decision rules described here.